Manufacturing Sector
   

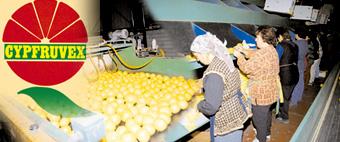
Citrus-packaging & processing at
Cypruvex
(Photo: Kibris)

Over the years the Turkish-Cypriot manufacturing industry developed very small, small and medium-sized enterprises, owing to the physical structure of the country.

Industrial activities are mainly focused in food and beverages, furniture and fixtures, metal and non-metallic industries, textile and clothing and other such light industries.

The manufacturing industry achieved one of the highest rates of growth during 1977-2003 period. The value added of the sector increased from 317.2 million TL in 1977 to 897.4 million TL in 2003 with an annual average increase of 4.1% at constant prices of 1977. 

   
  Statistical Pattern of the Share of Manufacturing Sector
1999  2000 2001 2002 2003
% Share of GDP 11.7 12.2 12.0 11.9 11.6
% Share of EAP 9.8 9.6 9.6 9.5 9.3
% Share of Exports 61.2 67.9 63.3 57.5 57.6
% Share of Total
 Fixed Investment* 
9.5 13.2 10.9 13.6 20.3
  * Based on 1977 constant prices (in million TL).
   
  The share of the sector in the GDP increased from 8.4% in 1977 to 11.8% in 2003 and the export of the industrial products accounted for 57.5% of the total domestic exports. From the year 1974 to the year 2002, the number of production units increased from 230 to 919 and the number of personnel employed in these units increased from 2,148 to 9,239 (table below).  
   
  Units and Employment in the Manufacturing Sector
 
  1998 1999 2000 2001 2002
 

Units

Emp.

Units

Emp.

Units

Emp.

Units

Emp.

Units

Emp.

1. Food, Beverages and Tobacco

197

2.977

264

2.964

275

2.842

266

2.850

266

2.867

2. Textile, Wearing Apparel & Leather Products

56

2.135

60

2.467

56

1.950

55

1.963

56

1.967

3. Forest Products and Furniture and Fixtures

62

445

87

483

192

893

189

858

187

849

4. Paper and Paper Products

39

485

68

436

69

390

61

458

63

479

5. Chemicals petroleum and Plastics

40

516

46

588

60

756

56

655

57

662

6. Non Metallic Mineral
Products

51

1.028

88

1.014

97

1.082

96

1.199

98

1.214

7. Basic Metal Industry

22

218

85

242

147

939

143

900

143

805

8. Electrical Machinery and Appliances

6

57

9

64

9

70

9

72

9

72

9. Other Manufacturing
Industry

26

349

33

313

39

336

40

342

40

324

TOTAL

499

8.210

740

8.571

944

9.258

915

9.297

919

9.239


Sources